For those unfamiliar with the mathematics behind polynomial trend-lines, here is an example of one country plotted using 3rd, 4th, 5th and 6th order polynomial trend lines.
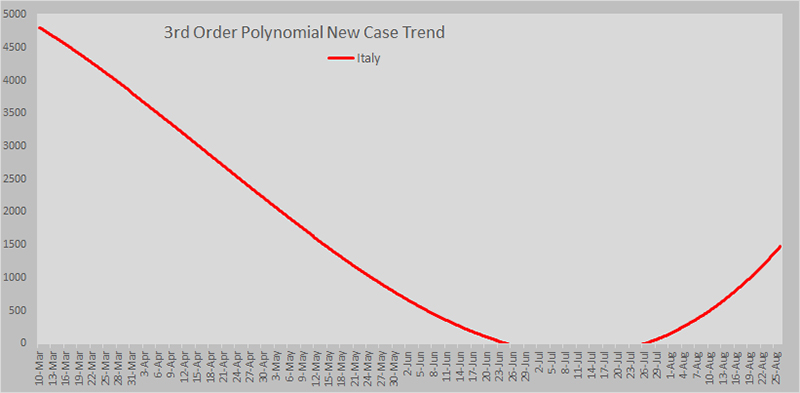
The 3rd order shows a fairly smooth curve that trends downwards from almost the start until it trends upward again from late July.
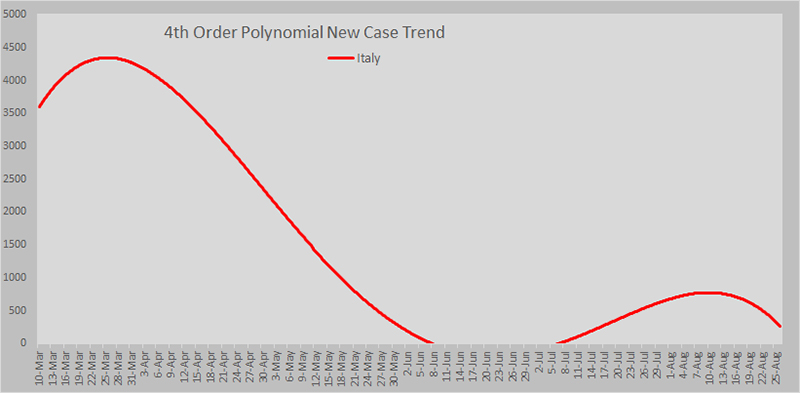
The 4th order shows that it actually climbed during the latter part of March before declining through to early July when it trended upward again before trending down again over the last fortnight.
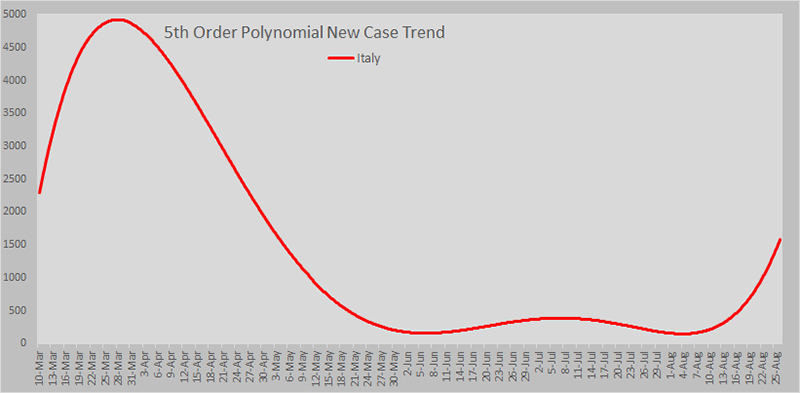
The 5th order shows a steeper climb in late March as well as an upward climb over the last 2-3 weeks.

Finally, the 6th order trend line shows much the same pattern as the 5th but not as pronounced.
So which is actually right given that 3 of the graphs show an upward trend at the end of the graph while the other shows it moving downward?
Let's break it into sections.
Looking at the raw data, the initial part of the graph should show a higher entry point before a small dip and then a steady climb through to about mid-March so that pretty much rules out the 3rd order graph as it doesn't even do that.
In the latter part of the graph the raw numbers started to climb again from early August and then more steeply over the last 10 days or so on which basis, the 5th order is the most representative of the raw data.