Australia
NSW records 25,870 cases in the current period and the 10-day average growth rate increases to 1.0461 (from 1.0254) while the actual line remains below the predictive trend line.

VIC records 37,994 cases in the current period (a new record high) and the 10-day average growth rate decreases to 1.2225 (from 1.2391) while the actual line remains above the predictive trend albeit only just.

No States set new daily highs yesterday (10/1).
Finally, here is the predictive trend graph for both NSW / Victoria based on cases since Omicron was identified which, for our purposes, will be taken as December 1st.

Overlay
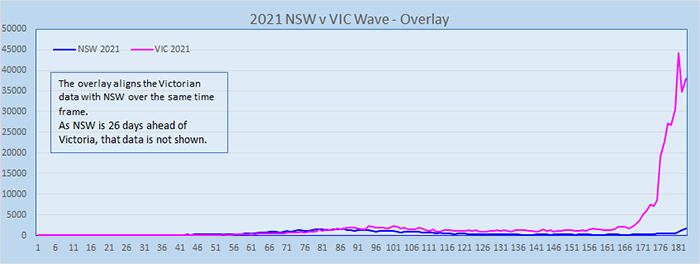
Week 26 in Victoria ended today with
425,317 cases to date compared to
20,155 at the same point of the 2020 outbreak and
86,020 at the same point for the NSW 2021 outbreak although without Omicorn at that stage. Weekly case numbers see Victoria with lots more cases than NSW in that week and overall case numbers for Victoria are up by
167k on last week. Note that we are comparing historical data for NSW with current data for Victoria as NSW is about 3.5 weeks ahead.

Mind you, if we align those graphs to the same calendar dates up to the end of the last full week for NSW, it looks like this:
