Australia / New Zealand
NSW records 13,775 cases for a 10-day average growth rate of 1.0758 (1.0349) and the actual line remains just below the predictive trend line.

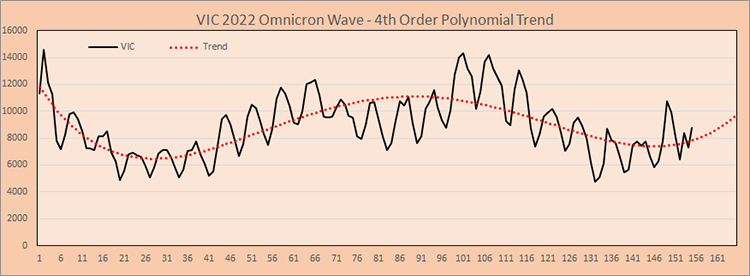
VIC records 10,056 cases for a 10 day average growth of 1.0754 (1.0482) while the actual line rises above the predictive trend. Victoria also passes 4,000 deaths for whole of pandemic.
Here is the predictive trend graph for four States based on cases since Omicron was identified which, for our purposes, will be taken as December 1st.

New Zealand data goes back to January 15th and the actual line is about level with the predictive trend line.

As it was the end of our week yesterday, here are the weekly case numbers with NSW having 9,549 more cases than Victoria last week while Victoria recorded 10,135 more cases than the previous week; NSW recorded 13,889 more, Queensland 4,919 more; WA 3,303 more and SA 2,616 more. The week totalled 241,539 cases, an 18.3% increase on last week.
