|
|
 |
|
|
|
Welcome to the Australian Ford Forums forum. You are currently viewing our boards as a guest which gives you limited access to view most discussions and inserts advertising. By joining our free community you will have access to post topics, communicate privately with other members, respond to polls, upload content and access many other special features without post based advertising banners. Registration is simple and absolutely free so please, join our community today! If you have any problems with the registration process or your account login, please contact us. Please Note: All new registrations go through a manual approval queue to keep spammers out. This is checked twice each day so there will be a delay before your registration is activated. |
|
|||||||
| The Bar For non Automotive Related Chat |
|
|
Thread Tools | Display Modes |
|
|
#10 | ||
|
Chairman & Administrator
  Join Date: Dec 2004
Location: 1975
Posts: 107,308
|
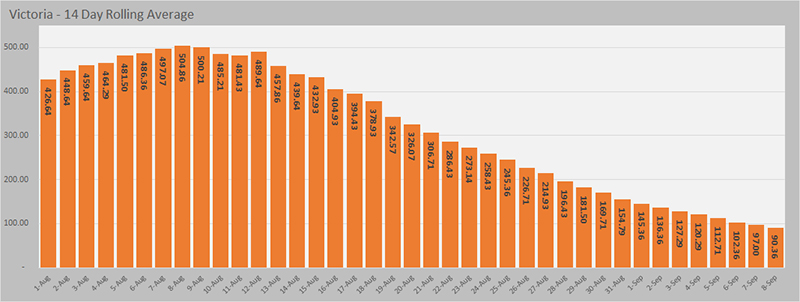
Given that the Victorian easing of restrictions is linked to the 14 day rolling average for new cases, here is a chart depicting the current movement in those numbers.
Note that the guidelines for the next Stage in the road map are based on 'metro' and ' regional' having different targets but I don't have a readily available data set to split between the two so these are the State based averages and thus show a worse result than metro would in isolation. The target is 30-50 new cases on a rolling 14D average. The move to the 3rd stage (> 26 October and < 5 cases Statewide) is back to whole of State numbers as is the 4th stage (0 cases for >=14D).  I'll add that graph to each of the daily stats.
__________________
 Observatio Facta Rotae
|
||
|
|
| 7 users like this post: |